Crypto
How to read crypto charts
Complete Beginner’s Guide to Reading Crypto Charts?

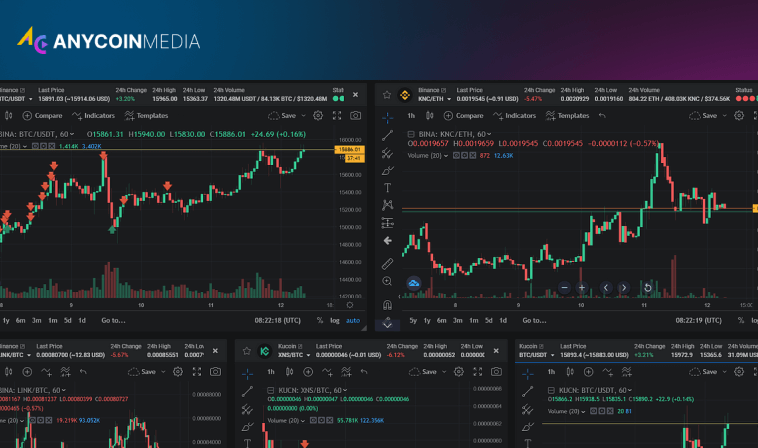
In the fast-paced world of cryptocurrency trading, charts act as a compass, guiding buyers through the stormy seas of market volatility. These visual representations of rate dynamics, buying and selling volumes, and market developments are essential tools for anyone navigating cryptocurrency markets properly. Understanding how to examine and interpret these charts can mean the difference between making an informed choice and falling victim to the vagaries of the market.

The Basics of Cryptocurrency Charts

At their core, cryptocurrency charts are graphical representations of an asset’s price movement over time. These charts come in various forms, each offering unique insights into market behavior. The most common types of charts include:

  • Line charts;
  • Candlestick charts;
  • Bar charts;
  • Point and figure charts.

Each chart type has its strengths and weaknesses, catering to different trading styles and analysis techniques. Mastering the art of chart reading begins with understanding these fundamental chart types and their applications in cryptocurrency trading.

Anatomy of a Chart

Before delving into specific chart types, it’s crucial to understand the basic elements common to most cryptocurrency charts:

  • X-axis. Typically represents time, moving from left to right;
  • Y-axis. Represents price, with higher values at the top;
  • Price line/bars/candles. Visual representation of price movement;
  • Volume bars. Indicate trading volume, often displayed at the bottom of the chart;
  • Indicators. Additional data points or lines overlaid on the chart to provide further analysis.

These elements work together to provide a comprehensive view of an asset’s price action and market behavior. Understanding how to interpret these components is the first step in becoming proficient at chart analysis.

Candlestick Charts: The Trader’s Favorite

Candlestick charts have become the go-to choice for many cryptocurrency traders due to their ability to convey a wealth of information at a glance. These charts consist of “candles” that represent price action over a specific time frame.

Each candle in a candlestick chart tells a story:

  • Body. The thick part of the candle, showing the opening and closing prices;
  • Wick (or shadow). The thin lines extending from the body, indicating high and low prices;
  • Color. Typically, green or white for price increases, red or black for decreases.

The shape and color of candlesticks can reveal patterns that traders use to make predictions about future price movements. Some popular candlestick patterns include:

  1. Doji. Indicates indecision in the market;
  2. Hammer. Potential reversal of a downtrend;
  3. Shooting Star. Possible reversal of an uptrend;
  4. Engulfing patterns. Strong reversal signals.

Mastering the interpretation of candlestick patterns can provide traders with valuable insights into market psychology and potential price directions.

Volume: The Oft-Overlooked Indicator

While price action often takes center stage, volume is a critical component of chart analysis that should not be overlooked. Volume bars, typically displayed at the bottom of charts, indicate the number of units of a cryptocurrency traded during a given time period.

Volume can provide several key insights:

  • Trend confirmation. Increasing volume during a price move can confirm the strength of a trend;
  • Potential reversals. Divergences between price and volume can signal upcoming trend changes;
  • Breakout validation. High volume during a breakout suggests a higher likelihood of continuation.

Incorporating volume analysis into chart reading can significantly enhance a trader’s ability to make informed decisions.

Technical Indicators: Enhancing Chart Analysis

Technical indicators are mathematical calculations based on price, volume, or other data points that are plotted on or alongside price charts. These indicators can provide additional insights into market trends, momentum, and potential reversal points.

Some popular technical indicators include:

  • Moving Averages (MA);
  • Relative Strength Index (RSI);
  • Moving Average Convergence Divergence (MACD);
  • Bollinger Bands.

Each indicator serves a specific purpose and can be used in combination with others to form a comprehensive trading strategy. However, it’s important to avoid cluttering charts with too many indicators, as this can lead to analysis paralysis.

Understanding how to interpret and apply these indicators effectively is a crucial skill for any cryptocurrency trader looking to gain an edge in the market.

Chart Patterns: Recognizing Market Sentiment

Chart patterns are recurring formations that appear on price charts and are believed to indicate future price movements. These patterns reflect the collective psychology of market participants and can offer insights into potential trend continuations or reversals.

Some common chart patterns in cryptocurrency markets include:

  • Head and Shoulders;
  • Double Top/Bottom;
  • Triangles (Ascending, Descending, Symmetrical);
  • Cup and Handle;
  • Flag and Pennant.

Identifying these patterns requires practice and a keen eye, but they can be powerful tools when used in conjunction with other analysis techniques.

Time Frames: Zooming In and Out

Cryptocurrency charts can be viewed across various time frames, from minute-by-minute to yearly charts. Each time frame offers a different perspective on price action and can be useful for different trading strategies.

Time Frame Use Case
1-5 minute Scalping and short-term trades
15-30 minute Intraday trading
1-4 hour Swing trading
Daily Medium to long-term trends
Weekly/Monthly Long-term investment decisions

Analyzing multiple time frames can provide a more comprehensive view of market trends and help traders make more informed decisions. It’s often recommended to start with higher time frames to identify overall trends before zooming in to find specific entry or exit points.

Putting It All Together: Developing a Chart Reading Strategy

Effective chart reading in cryptocurrency markets requires a combination of technical skills, pattern recognition, and an understanding of market psychology. Developing a robust chart reading strategy involves:

  • Choosing appropriate chart types for your trading style;
  • Identifying key support and resistance levels;
  • Recognizing trends and potential reversal points;
  • Utilizing technical indicators to confirm observations;
  • Considering multiple time frames for a comprehensive view;
  • Incorporating volume analysis into decision-making;
  • Staying aware of fundamental factors that may impact price action.

By integrating these elements, traders can develop a holistic approach to chart analysis that goes beyond simple price observation.

In conclusion, acquiring knowledge of the art of studying cryptocurrency charts is essential for anyone seeking to navigate the choppy waters of virtual asset markets. While charts provide valuable information, it is essential to remember that they are assessment tools, not crystal balls. Combining chart reading talent with the necessary valuation, risk management, and knowledge of market dynamics is the foundation of developing a successful buying, selling, or financing method in the cryptocurrency space.

As the cryptocurrency market adapts, so will the strategies and equipment used to evaluate charts. Knowing new signs, chart types, and analysis techniques can be important for traders looking to maintain their share of this dynamic market.

Frequently Asked Questions

Are cryptocurrency charts different from traditional stock market charts?

While the basic principles are similar, crypto charts often feature higher volatility and 24/7 trading, which can lead to more dramatic price movements and patterns.

How often should I check cryptocurrency charts?

The frequency depends on your trading strategy. Long-term investors might check weekly or monthly, while day traders may monitor charts continuously.

Can chart patterns guarantee future price movements?

No, chart patterns are not guarantees but rather indications of potential outcomes based on historical data and market psychology.

What’s the best time frame for analyzing crypto charts?

There’s no single “best” time frame. It depends on your trading strategy and the type of analysis you’re conducting.

How important is volume in cryptocurrency chart analysis?

Volume is crucial as it can confirm trends, signal potential reversals, and indicate the strength of price movements.

noah chesterton
Noah Chesterton Card Games Reviewer
Noah is an expert in cryptocurrencies and gambling. He has extensive experience in these fields and provides useful information for beginners and professionals alike.
Written Articles
50
written articles
Years Work An Expert
10
years work an expert
Articles As A Guest
200+
Articles as a guest
Reviews Total
200+
Reviews total

Author's articles

What Does Pegging Mean In Crypto  A Detailed Guide
Crypto
Exchanges
Investing
Pegging in Crypto: Unveiling the Mechanics of Stable Value
Cryptocurrency markets are renowned for their volatility, with prices often fluctuating dramatically within short periods. This inh...
Best ways how to make money with NFTs for Beginners
Crypto
Investing
Best ways how to make money with NFTs for Beginners
Non-fungible tokens (NFTs) have taken the digital world by storm, offering a unique blend of art, technology, and finance. These bl...
What is Slippage in Crypto Purchases and How to Minimise it
Crypto
Finance
Investing
Slippage in Crypto Purchases: Understanding and Minimizing Its Impact
Cryptocurrency trading has revolutionized the financial landscape, offering unprecedented opportunities for investors and enthusias...
How does a cryptocurrency gain value
Crypto
Finance
Investing
How Cryptocurrencies Gain Value
The world of digital currencies has exploded in recent years, captivating investors and tech enthusiasts alike. Cryptocurrencies, o...

Related topics

10 Non KYC Exchanges  Investors Guide 2024
Crypto
Exchanges
10 Non-KYC Exchanges: Investor’s Guide 2024
In the ever-evolving landscape of cryptocurrency trading, privacy remains a paramount concern for many investors. As regulatory pre...
crypto faucet
Crypto
Finance
What is a Crypto Faucet?
In the vast and often perplexing world of cryptocurrencies, crypto faucets stand out as a unique and intriguing concept. These digi...
is shiba inu dead
Crypto
Exchanges
Finance
Is Shiba Inu Dead?
In the volatile world of cryptocurrencies, few tokens have captured the public imagination quite like Shiba Inu (SHIB). This meme-i...
Crypto Bear Market Strategies 1
Crypto
Exchanges
Cryptocurrency Bear Market: Strategies for Smart Investor
Cryptocurrency bear markets are an inevitable part of the investment cycle. These long intervals of declining asset values ​&...
Portugal for Crypto Traders  The Complete Guide
Crypto
Finance
Portugal for Crypto Traders: The Complete Guide
Portugal has become a beacon for cryptocurrency enthusiasts and investors seeking a haven for virtual asset sports. This sun-drench...
Centralized Exchange VS Decentralized Exchange 1
Crypto
Exchanges
Finance
Centralized Exchange VS Decentralized Exchange
The cryptocurrency ecosystem has evolved rapidly since Bitcoin’s inception, giving rise to various trading platforms that cat...
Front Running Attacks in Blockchain  The Complete Guide
Crypto
Exchanges
Finance
Front-Running Attacks in Blockchain: The Complete Guide
Blockchain technology, heralded for its transparency and security, ironically harbors vulnerabilities that savvy operators can expl...
Is Staking Crypto Safe  Understanding the Risks
Crypto
Exchanges
Finance
Is Staking Crypto Safe? Understanding the Risks
Cryptocurrency staking has emerged as a popular method for holders to earn passive income while contributing to network security. T...
How to Sell an NFT  A Comprehensive Guide
Crypto
Finance
Investing
How to Sell an NFT: A Comprehensive Guide
Non-fungible tokens (NFTs) have revolutionized digital ownership, creating new opportunities for creators and collectors alike. The...
How does a cryptocurrency gain value
Crypto
Finance
Investing
How Cryptocurrencies Gain Value
The world of digital currencies has exploded in recent years, captivating investors and tech enthusiasts alike. Cryptocurrencies, o...
What is Slippage in Crypto Purchases and How to Minimise it
Crypto
Finance
Investing
Slippage in Crypto Purchases: Understanding and Minimizing Its Impact
Cryptocurrency trading has revolutionized the financial landscape, offering unprecedented opportunities for investors and enthusias...
Best ways how to make money with NFTs for Beginners
Crypto
Investing
Best ways how to make money with NFTs for Beginners
Non-fungible tokens (NFTs) have taken the digital world by storm, offering a unique blend of art, technology, and finance. These bl...
What Does Pegging Mean In Crypto  A Detailed Guide
Crypto
Exchanges
Investing
Pegging in Crypto: Unveiling the Mechanics of Stable Value
Cryptocurrency markets are renowned for their volatility, with prices often fluctuating dramatically within short periods. This inh...
img
Subscribe to Our Newsletter!
Don't miss the opportunity to stay up to date with all the latest news, special offers and unique promotions !

    img
    Your subscription has been successfully completed!